5 Interactive JavaScript charts for your website

I’m starting to see a lot of these charts used on websites I frequently visit – such as Dribbble pro account page and Carbon Ads Dashboard. Here’s a list of 5 popular ones worth checking out.
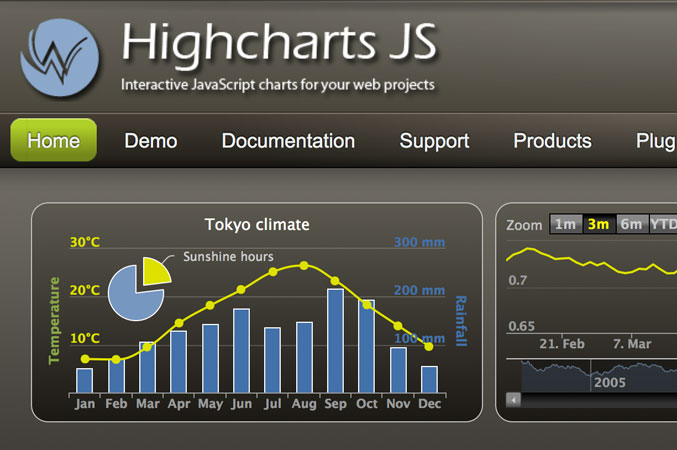
Highcharts:
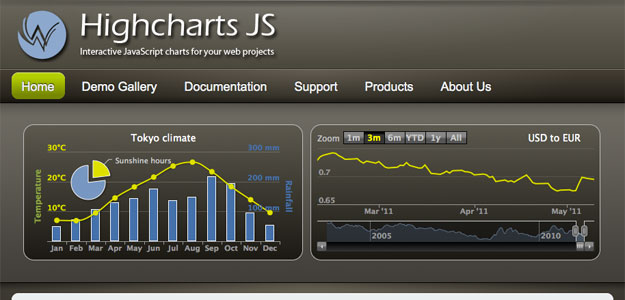
Highcharts is a charting library written in pure JavaScript, offering intuitive, interactive charts to your web site or web application. Highcharts currently supports line, spline, area, areaspline, column, bar, pie and scatter chart types.
jqPlot:
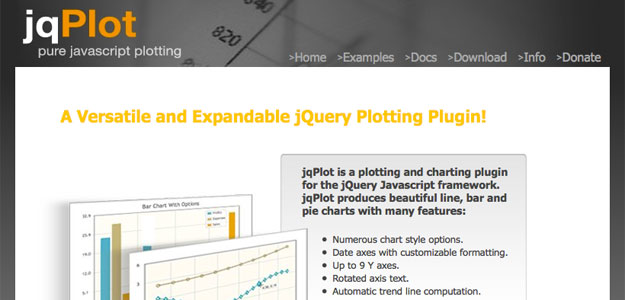
jqPlot is a plotting and charting plugin for the jQuery Javascript framework. jqPlot produces beautiful line, bar and pie charts with many features.
flot:
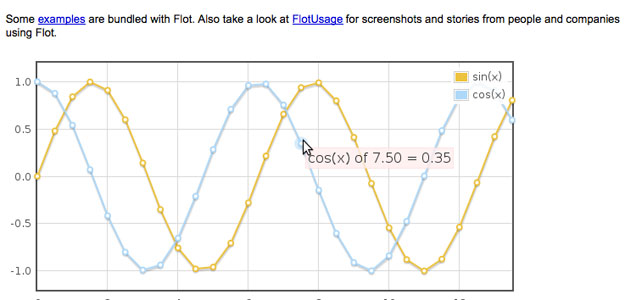
Flot is a pure Javascript plotting library for jQuery. It produces graphical plots of arbitrary datasets on-the-fly client-side. The focus is on simple usage (all settings are optional), attractive looks and interactive features like zooming and mouse tracking.
MooChart:
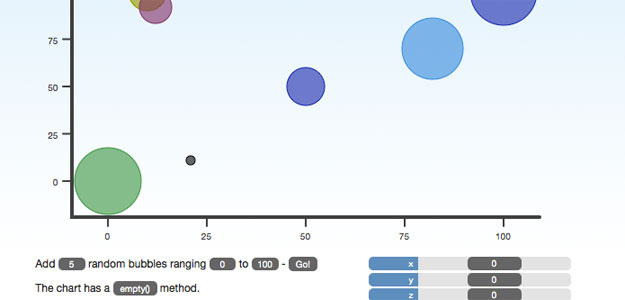
moochart is a plugin for MooTools 1.2 that draws bubble diagrams on the canvas tag. Future versions might include pie, bar & line graphs.
FusionCharts:
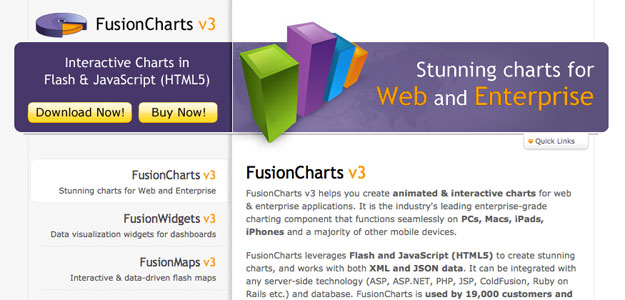
FusionCharts v3 helps you create animated & interactive charts for web & enterprise applications. It is the industry’s leading enterprise-grade charting component that functions seamlessly on PCs, Macs, iPads, iPhones and a majority of other mobile devices.
13 Comments
We’ve recently created a javascript webgl lib for 3D charts: http://incharts3d.com
I can add ShieldUI to the list. Their Chart javascript component provides a set of jQuery extensions (plugins) for rendering feature-rich charts and graphs. You can check them at https://shieldui.com/
Plenty of examples at the demos section -https://demos.shieldui.com/
Why is’t that google chart is not on the list? By the way Thanks for the list. I will be using Flot for my website soon.
Shield UI is a powerful and feature-rich JavaScript library. It also provides server-side components for ASP.NET, ASP.NET MVC and Java Apache Wicket.
Check how powerful it is at: https://demos.shieldui.com
Company website: https://www.shieldui.com
FusionCharts gets my vote. It can render over 90 charts and gauges in JavaScript, and has very extensive documentation
Just what I’ve been looking for!! Thank you!!
Hi Louis,
Thx for your list. Recently I have also stumbled on a new chartting library, which looks very good and is quite easy to use. It might be worth to check it out, too:
ArcadiaCharts
According to the website, “this library can also be used for free even for commercial use on a “give and take” basis.”
Louis, you may also check dhtmlxChart, a simple JavaScript charting library based on Canvas. It supports the basic chart types: line, bar, area, pie, radar, etc. The library is GPL-licensed.
Demos: http://www.dhtmlx.com/docs/products/dhtmlxChart/index.shtml