
5 JavaScript Tools for Interactive Website Charts
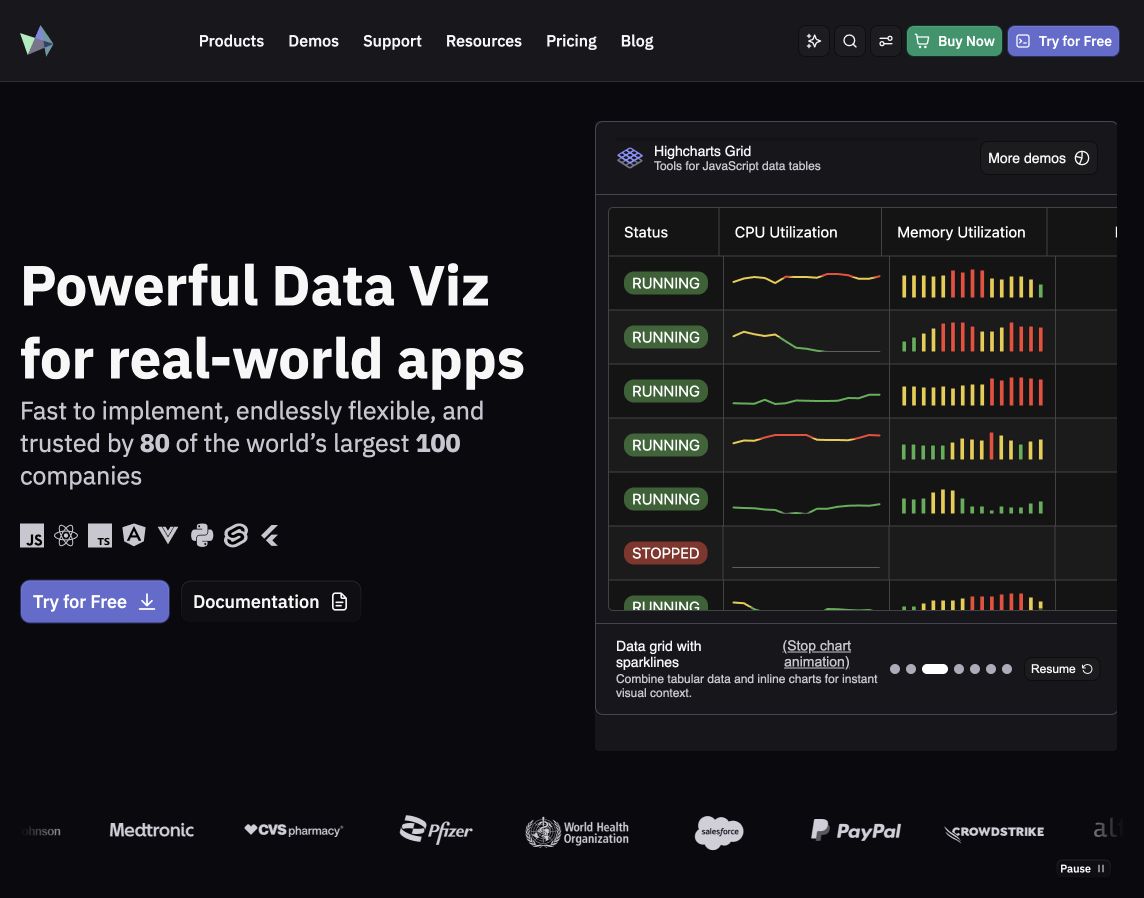
Featured screenshot: Highcharts’ current homepage. The tool screenshots below show public examples captured in October 2026.
A useful chart helps someone compare values, spot a trend, or decide what to do next. For a website or dashboard, the right JavaScript tool depends on the data, the interactions people need, and how much custom development you can maintain.
These five options cover common reporting charts through custom data visualizations. The choices below are starting points for evaluation, not a performance ranking.
Five chart tools to consider
1. Chart.js: familiar website charts
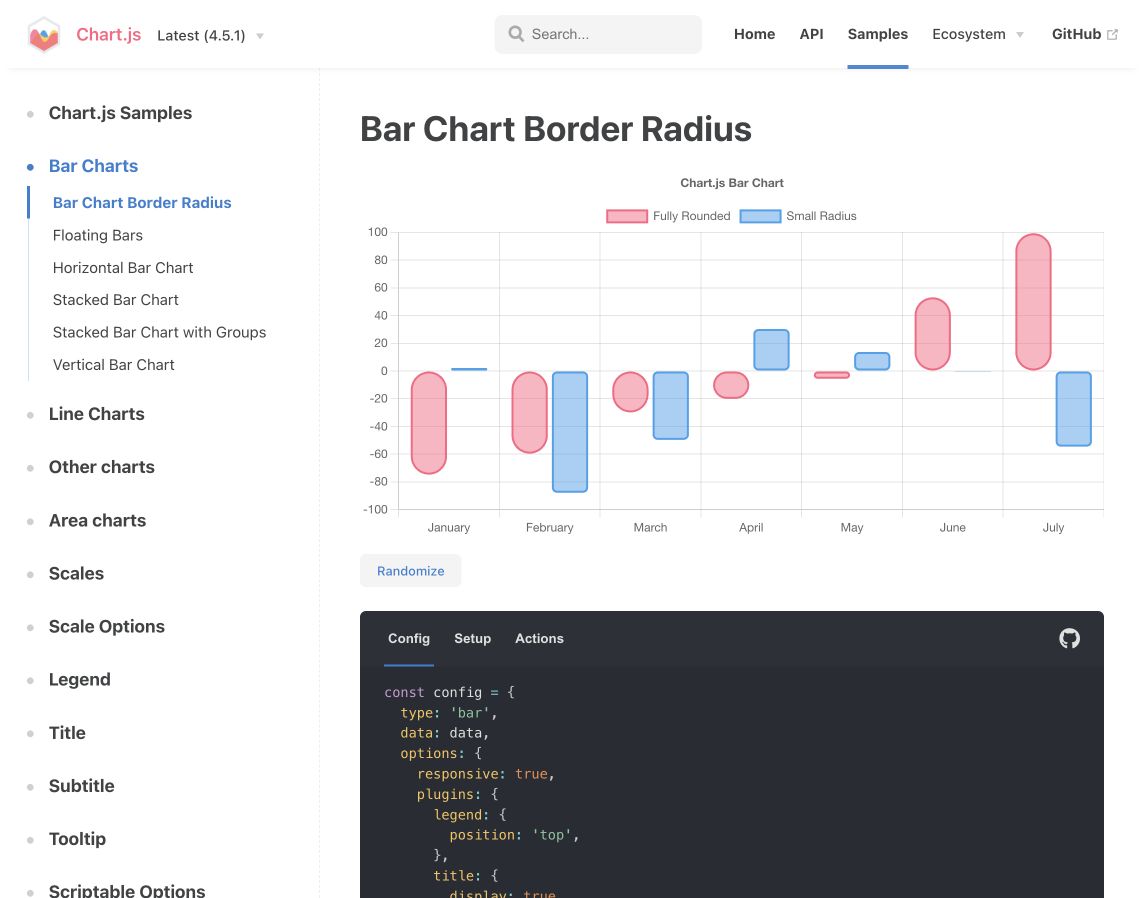
Chart.js is a practical starting point for line, bar, and other familiar charts in a reporting page. It draws on canvas and lets developers update existing charts as data changes. Plan the text alternative alongside the visual: canvas content is not inherently available to screen readers.
2. Apache ECharts: configurable dashboards
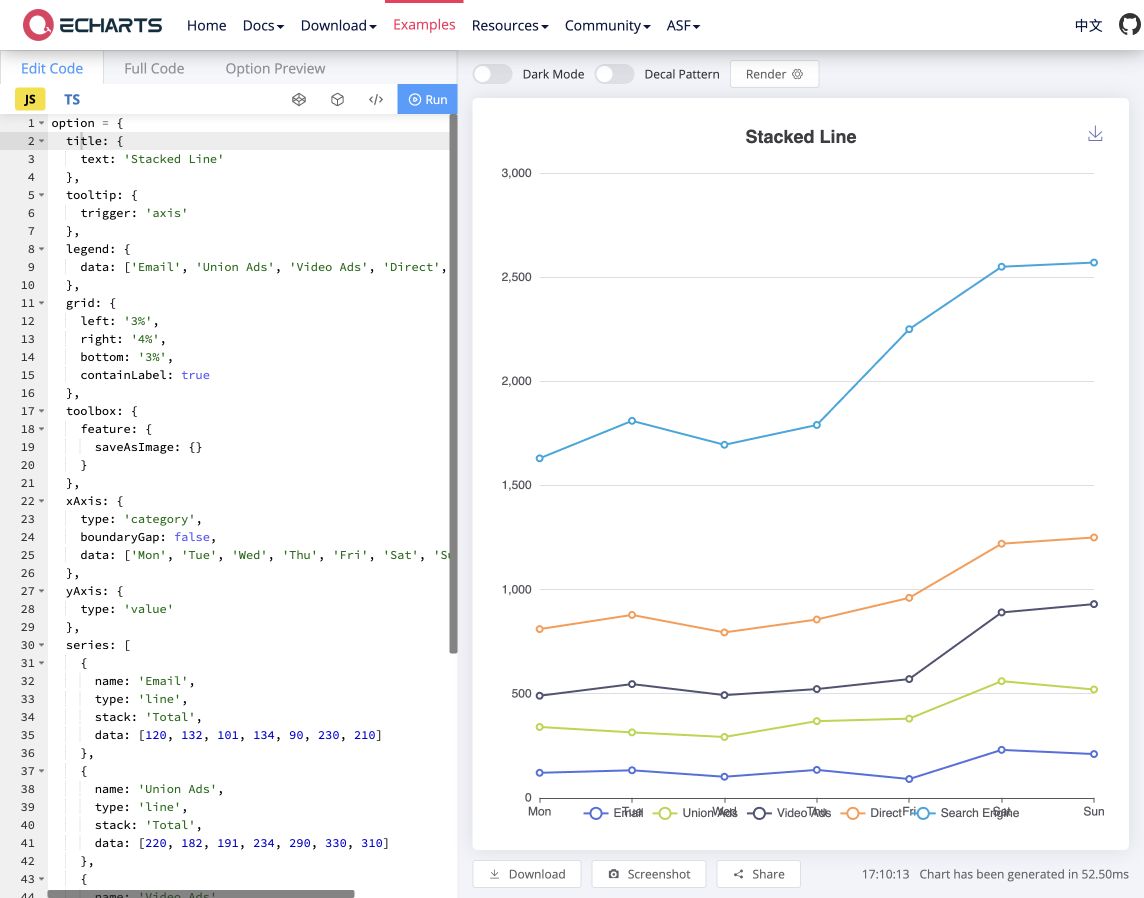
Apache ECharts supports both Canvas and SVG rendering, giving developers a choice to test against the actual dataset and device. Its events and data-update features suit dashboards with filters and changing views. ARIA descriptions and decal patterns need to be enabled and configured; accessibility is not automatic.
3. Highcharts: charts with accessibility tooling
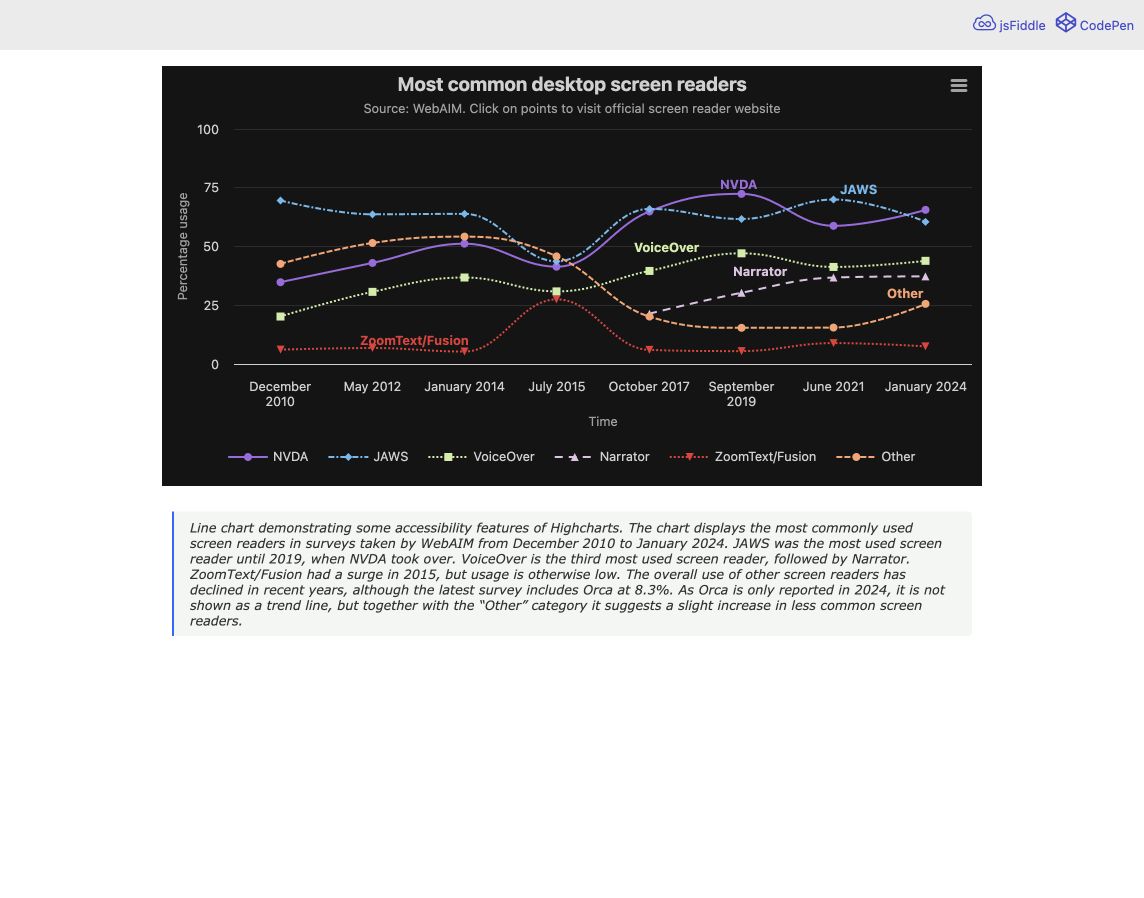
Highcharts’ Accessibility module provides keyboard navigation and screen-reader support. Include and test that module, then supply meaningful titles, series names, and a description of the takeaway. Check the current licensing requirements before using Highcharts in a production project.
4. D3.js: custom data visualizations
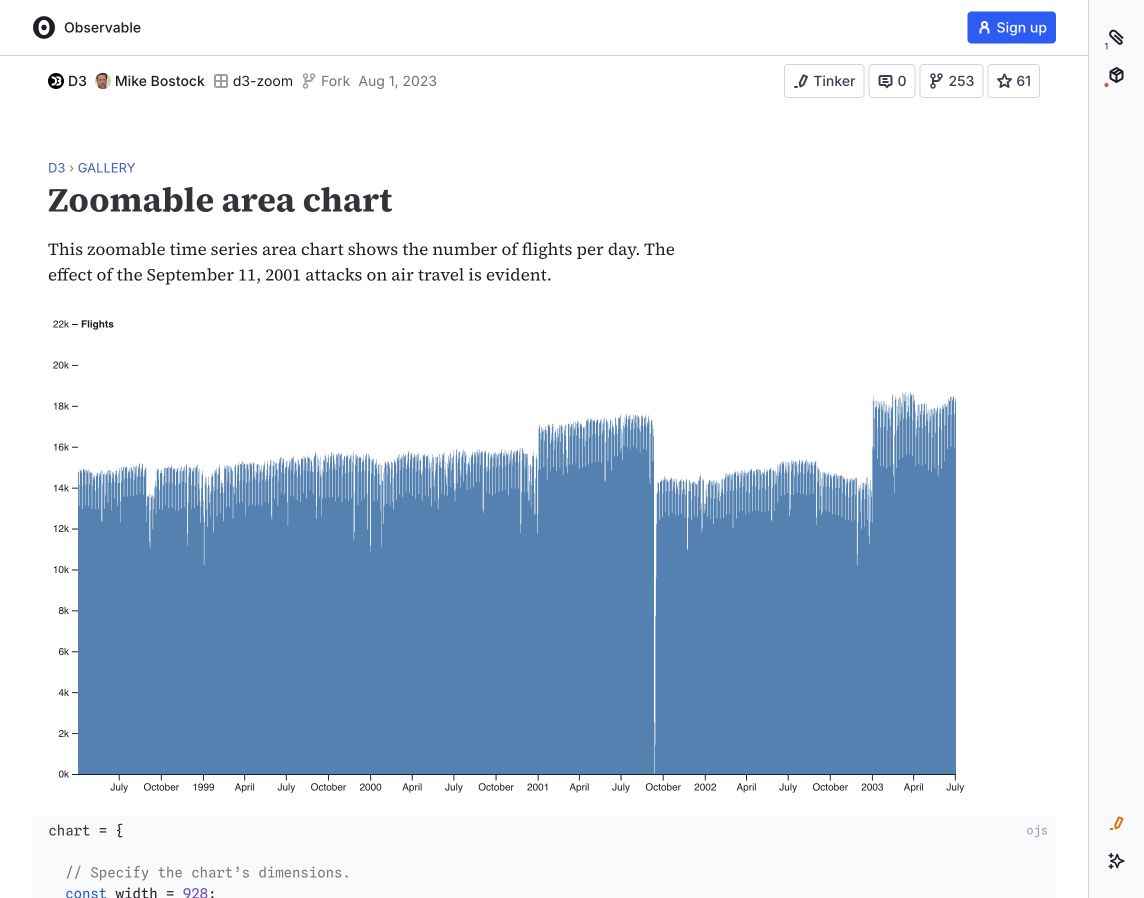
D3.js is a visualization toolbox built around web standards such as SVG and Canvas. It makes sense when the project needs a custom visual form or interaction. It is not a ready-made chart component: your developer assembles the scales, shapes, labels, and behavior, and owns the responsive and accessible experience.
5. Plotly.js: analytical and scientific charts
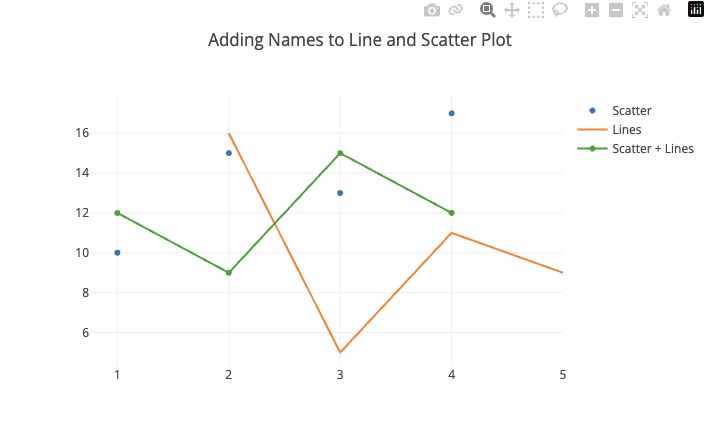
Plotly.js offers statistical, scientific, financial, and 3D chart types. Rendering uses SVG or WebGL depending on the chart type. Consider it when an analytical view needs more than a basic bar or line chart, and test the chosen chart with realistic data on the devices your audience uses.
What to check before publishing
- The question: give the chart a clear title and state the main takeaway in nearby text.
- Access to the data: offer a readable table or download where appropriate. Test keyboard and screen-reader access; color and hover tooltips should not carry the whole meaning.
- Mobile layout: check labels, touch controls, and the chart container at narrow widths. Reduce clutter rather than shrinking everything.
- Real data: test long labels, missing values, empty results, loading failures, and the largest dataset you expect.
Can these charts work in WordPress or with JSON data?
Yes, with an integration that loads the library and passes it the expected data format. A chart can use data prepared from a JSON file or an API; it does not need a separate hosted dashboard. Keep private credentials and access checks on the server, and give readers a useful explanation if the data cannot load.
For a chart inside a client portal, reporting tool, or connected workflow, explore our custom application development services. The data source and the decision the chart supports are good places to start.
Originally published in 2011; recommendations reviewed and rewritten in October 2026. The earlier list included jqPlot, Flot, MooChart, and FusionCharts. Older reader comments refer to that version.
10 Comments
We’ve recently created a javascript webgl lib for 3D charts: http://incharts3d.com
I can add ShieldUI to the list. Their Chart javascript component provides a set of jQuery extensions (plugins) for rendering feature-rich charts and graphs. You can check them at https://shieldui.com/
Plenty of examples at the demos section -https://demos.shieldui.com/
Why is’t that google chart is not on the list? By the way Thanks for the list. I will be using Flot for my website soon.
Shield UI is a powerful and feature-rich JavaScript library. It also provides server-side components for ASP.NET, ASP.NET MVC and Java Apache Wicket.
Check how powerful it is at: https://demos.shieldui.com
Company website: https://www.shieldui.com
FusionCharts gets my vote. It can render over 90 charts and gauges in JavaScript, and has very extensive documentation
Just what I’ve been looking for!! Thank you!!
Hi Louis,
Thx for your list. Recently I have also stumbled on a new chartting library, which looks very good and is quite easy to use. It might be worth to check it out, too:
ArcadiaCharts
According to the website, “this library can also be used for free even for commercial use on a “give and take” basis.”
Louis, you may also check dhtmlxChart, a simple JavaScript charting library based on Canvas. It supports the basic chart types: line, bar, area, pie, radar, etc. The library is GPL-licensed.
Demos: http://www.dhtmlx.com/docs/products/dhtmlxChart/index.shtml